
Hypothesis testing#
Dan L. Nicolae
Hypothesis testing can be thought of as a way to investigate the consistency of a dataset with a model, where a model is a set of rules that describe how data are generated. The consistency is evaluated using ideas from probability and probability distributions.
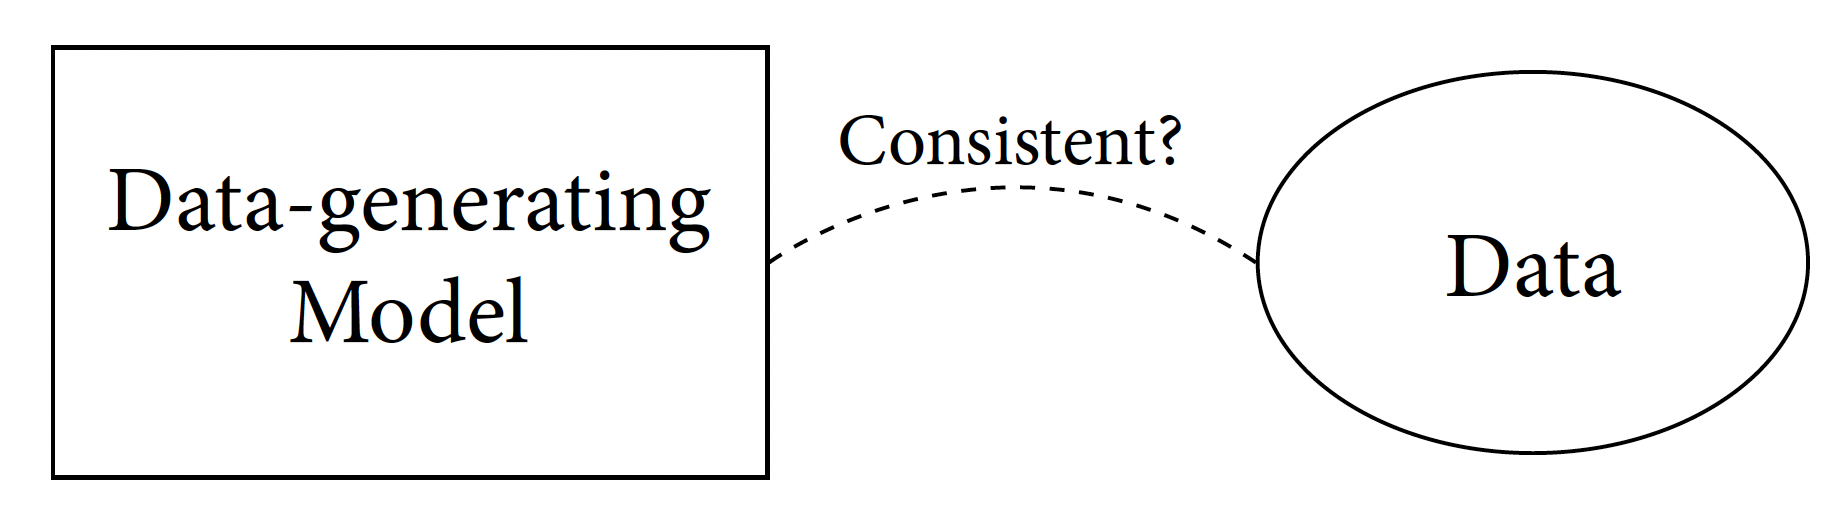
The consistency question in the above diagram is short for “Is it plausible that data was generated from this model?”
We will use a simple example to illustrate this. Suppose that a friend is telling you that she has an urn with 6 blue and 4 red balls from which 5 balls are extracted without replacement. The description in the previous sentence is that of a model with four rules:
there is an urn with 10 balls: 6 blue and 4 red;
a total of 5 balls are extracted;
the balls are extracted without replacement (once a ball is out of the urn, it cannot be selected again);
at each extraction, every ball in the urn has the same chance of being selected (this assumption is implicit in urn problems).
Suppose your friend reports the results of a drawing (these are the data) and here are two hypothetical scenarios (datasets):
Scenario 1: outcome is 5 red balls. Is this outcome consistent with the model above? The answer is clearly no as it is not possible to obtain 5 red balls when the first 3 rules above are true.
Scenario 2: outcome is 2 blue and 3 red balls. The answer here is not as obvious as above, but we can use probability to get an evaluation of how likely this outcome is. We will formalize this process in this chapter.
We will use these ideas in the next sections to answer questions that are more complicated: Is pollution associated with risk of cancer? Are weights of babies different for older mothers?
We end this introduction with examples of other data-generating models (so you can gain more insight before learning how to evaluate them):
A simple random sample of 10 voters from a population of size 10,000 where 40% of the subjects vote for candidate A, 35% for candidate B and 25% for candidate C.
Data from a binomial setting; this was introduced in the previous chapter where the binomial distribution comes from a sequence of Bernoulli trials that follow 4 rules: (i) a fixed number of trials; (ii) two possible outcomes for each trial; (iii) trials are independent; and (iv) the probability of success is the same for each trial
A set of 100 observations generated independently from a Unif(1,5) distribution.