
The birthday problem: relaxed assumptions#
There are two assumptions we used in the last few sections while investigating the birthday problem - equally likely birthdates and ignoring February 29 as a possible birth date. While relaxing these can complicate the mathematical calculation, the simulations can be easily modified to account for more complicated scenarios.
We use below a dataset from FiveThirtyEight that contains the number of daily births in US between 2000 and 2014 to estimate the odds of each day of the year to be a birthday:
Note that in the following dataset, the variable for day of week is coded 1 for Monday and 7 for Sunday. Also note that there are four leap years in this dataset - finding the correct probability for being born in a leap year is beyond the scope of this section.
birth_data = pd.read_csv("../../data/US_births_2000-2014_SSA.csv")
birth_data
| year | month | date_of_month | day_of_week | births | |
|---|---|---|---|---|---|
| 0 | 2000 | 1 | 1 | 6 | 9083 |
| 1 | 2000 | 1 | 2 | 7 | 8006 |
| 2 | 2000 | 1 | 3 | 1 | 11363 |
| 3 | 2000 | 1 | 4 | 2 | 13032 |
| 4 | 2000 | 1 | 5 | 3 | 12558 |
| ... | ... | ... | ... | ... | ... |
| 5474 | 2014 | 12 | 27 | 6 | 8656 |
| 5475 | 2014 | 12 | 28 | 7 | 7724 |
| 5476 | 2014 | 12 | 29 | 1 | 12811 |
| 5477 | 2014 | 12 | 30 | 2 | 13634 |
| 5478 | 2014 | 12 | 31 | 3 | 11990 |
5479 rows × 5 columns
This is an interesting dataset and we encourage you to use it to answer questions like: what is the least frequent day of the week for giving birth?
The pandas library has commands that allow you to group rows by unique values in a column. We introduced it in Chapter 7.
counts_df=birth_data.groupby(['month','date_of_month']).sum()[['births']]
counts_df.head(5)
| births | ||
|---|---|---|
| month | date_of_month | |
| 1 | 1 | 116030 |
| 2 | 144083 | |
| 3 | 170115 | |
| 4 | 171663 | |
| 5 | 166682 |
We see that there were 116,030 births on January 1st, 144,083 (much larger! why?) on January 2nd etc. A histogram of the counts in the above data frame:
plt.hist(counts_df.births,bins = np.arange(116000, 195000, 2000))
plt.xticks(ticks=[130000,150000,170000,190000], labels=["130K","150K","170K","190K"])
plt.xlabel("Number of births");
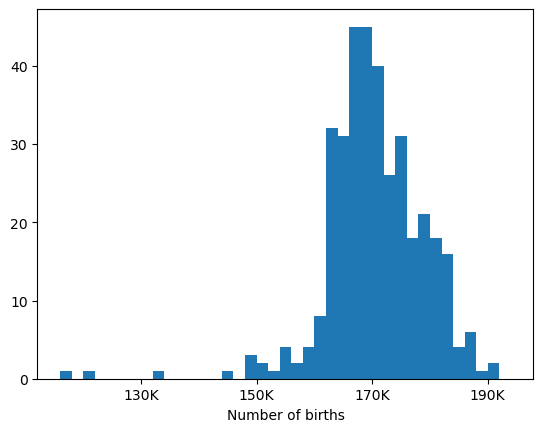
Note that some days of the year are outliers in number of births. Can you guess which?
We will use these counts to estimate the probability that a given date is a birthday for a random US subject.
bday_probs=counts_df.births/sum(counts_df.births)
These probabilities are added to the simulation when using the random.choice function. Look at the function below and compare it to the birthday_sim function introduced in Section 11.2.
# adding February 29 - the number of possible birthdays is now 366
birthdays2=np.arange(1,367,1)

def birthday_sim2(n,nrep,pr):
    '''Estimate birthday matching probabilities using nrep simulations.
       The 366 possible birthdays are weighted by given probabilities'''
    outcomes = np.array([])
    for i in np.arange(nrep):
        outcomes = np.append(outcomes,
                Counter(np.random.choice(birthdays2,n,p=pr)).most_common(1)[0][1])
    return outcomes
We calculate below the probability for the case \(n=23\) using these relaxed assumptions. Before running the cell or reading its output, do you think the probability will be higher or lower?
n=23
nrep=100000
sum(birthday_sim2(n,nrep,bday_probs)>1)/nrep
np.float64(0.50834)
Note: more accurate simulation experiments do not always lead to different results - but we do not know that before performing them!
We will continue to investigate the issue of analytical and computation approaches throughout this textbook.