
6.1. Applying Functions to DataFrames#
Now that we know the foundations of DataFrames and functions, we can discuss how to use functions directly on columns or rows of our DataFrame.
We will explore student grade data that provides fictional information on student math, reading, and writing scores, as well as some potential predictors of success. More information about the data can be found here.
student_scores_df = pd.read_csv('../../data/student_scores_data.csv')
student_scores_df.head(5)
| gender | race/ethnicity | parental level of education | lunch | test preparation course | math score | reading score | writing score | |
|---|---|---|---|---|---|---|---|---|
| 0 | female | group D | some college | standard | completed | 59 | 70 | 78 |
| 1 | male | group D | associate's degree | standard | none | 96 | 93 | 87 |
| 2 | female | group D | some college | free/reduced | none | 57 | 76 | 77 |
| 3 | male | group B | some college | free/reduced | none | 70 | 70 | 63 |
| 4 | female | group D | associate's degree | standard | none | 83 | 85 | 86 |
Apply Method#
The .apply method is used to apply functions to a DataFrame or subsets of a DataFrame. This method takes the form
df.apply(given_function)
where df is a DataFrame and given_function can be a built-in or user defined function.
Apply: Across Rows#
We can apply a built-in function to every single column of a DataFrame, or we can call the apply method on a single column. If we input the entire DataFrame, as below, we get the output of that function applied to each column.
student_scores_df.apply(len)
gender                         1000
race/ethnicity                 1000
parental level of education    1000
lunch                          1000
test preparation course        1000
math score                     1000
reading score                  1000
writing score                  1000
dtype: int64
It might be more useful to apply a function to an individual column or columns, as not all functions can be applied to all datatypes. We can take the average over the math score column by using the apply method with np.mean as input.
student_scores_df[['math score']].apply(np.mean)
math score    67.81
dtype: float64
Be aware, there are different defaults depending on if you are using .apply on a Series or DataFrame object. We saw above that applying np.mean on the DataFrame column takes the mean over the entire column. But if we try to do the same on a Series, this takes the mean of each individual element, see below (the average of one number is just that number as output).
student_scores_df['math score'].apply(np.mean)
0      59.0
1      96.0
2      57.0
3      70.0
4      83.0
       ...
995    77.0
996    80.0
997    67.0
998    80.0
999    58.0
Name: math score, Length: 1000, dtype: float64
We can use the apply method on more than one column at a time. If we want the average across the rows of math, reading, and writing, we call .apply on those given rows as input.
student_scores_df[['math score','reading score','writing score']].apply(np.mean) #Default is axis= 0
math score       67.810
reading score    70.382
writing score    69.140
dtype: float64
Apply: Across Columns#
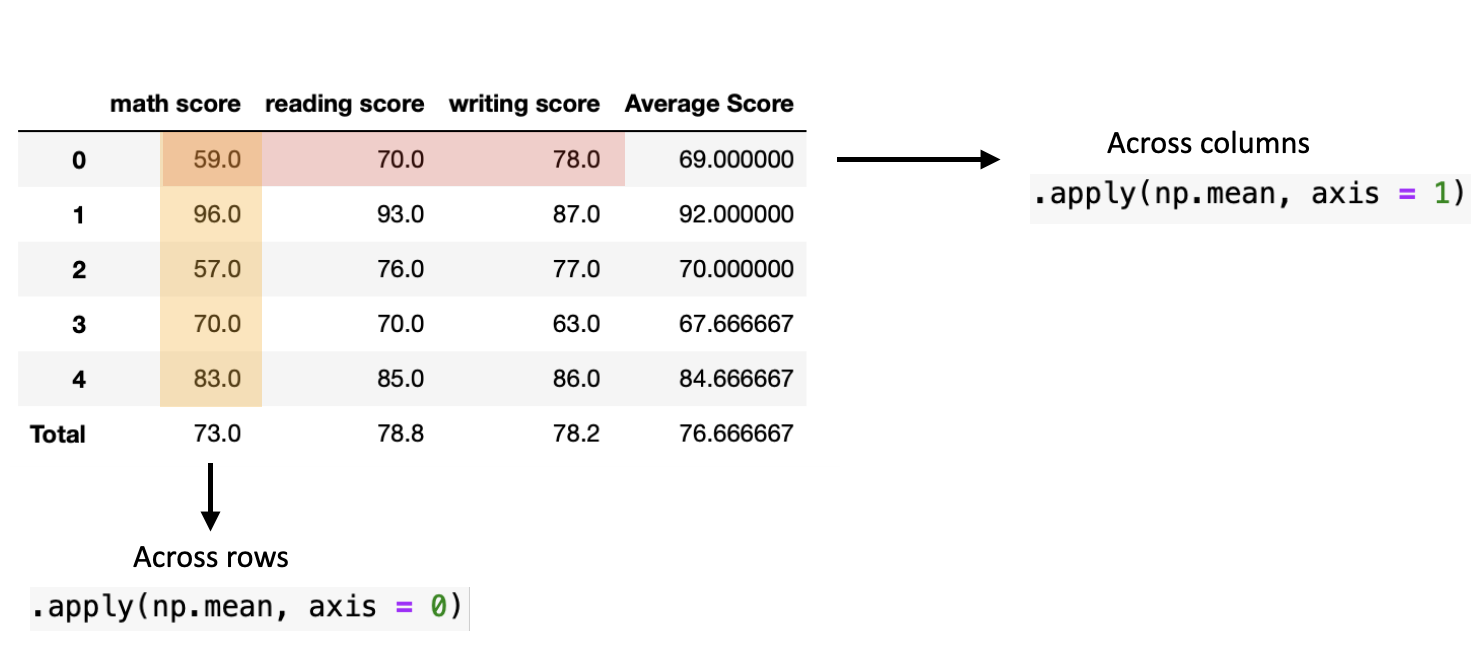
We might be interested in an individual’s average math, reading, and writing score instead of the average over just one subject. We can calculate this by specifying which axis of our DataFrame we want. To apply this function across columns of our data - for every row - we change the axis argument to axis = 1. By default the .apply method corresponds to applying the provided function across rows, that is setting axis = 0. Setting axis = 1 allows us to apply the function across columns.
student_scores_df[['math score','reading score','writing score']].apply(np.mean, axis = 1)
0      69.000000
1      92.000000
2      70.000000
3      67.666667
4      84.666667
         ...
995    75.000000
996    70.666667
997    79.666667
998    71.333333
999    50.000000
Length: 1000, dtype: float64
Including this new column in our DataFrame gives the following result.
student_scores_df['Average Score'] = student_scores_df[['math score','reading score','writing score']].apply(np.mean, axis = 1)
student_scores_df.head(5)
| gender | race/ethnicity | parental level of education | lunch | test preparation course | math score | reading score | writing score | Average Score | |
|---|---|---|---|---|---|---|---|---|---|
| 0 | female | group D | some college | standard | completed | 59 | 70 | 78 | 69.000000 |
| 1 | male | group D | associate's degree | standard | none | 96 | 93 | 87 | 92.000000 |
| 2 | female | group D | some college | free/reduced | none | 57 | 76 | 77 | 70.000000 |
| 3 | male | group B | some college | free/reduced | none | 70 | 70 | 63 | 67.666667 |
| 4 | female | group D | associate's degree | standard | none | 83 | 85 | 86 | 84.666667 |
To summarize the axis options for the .apply method on a DataFrame, see below.
Applying User-Defined Functions#
The .apply method is useful because we can apply our own functions to columns and rows of a DataFrame! Suppose we want to have a letter grade defined for each of the scores given in the dataset. We can do this by first defining such a function, and then applying it to one column, or multiple columns of that DataFrame.
We first define a function that takes in a number grade and converts this to a letter grade. Then we can apply this to our DataFrame.
def letter_grade(number_grade):
    '''Takes a numerical grade value and converts to a letter grade'''
    if 90 <= number_grade <= 100:
        return 'A'
    elif 80 <= number_grade < 90:
        return 'B'
    elif 70 <= number_grade < 80:
        return 'C'
    elif 60 <= number_grade < 70:
        return 'D'
    else:
        return 'F'
Across rows#
We use the .apply method on a single column, a series object, below, in combination with our letter_grade function.
student_scores_df['math grade'] = student_scores_df['math score'].apply(letter_grade)
student_scores_df.head(5)
| gender | race/ethnicity | parental level of education | lunch | test preparation course | math score | reading score | writing score | Average Score | math grade | |
|---|---|---|---|---|---|---|---|---|---|---|
| 0 | female | group D | some college | standard | completed | 59 | 70 | 78 | 69.000000 | F |
| 1 | male | group D | associate's degree | standard | none | 96 | 93 | 87 | 92.000000 | A |
| 2 | female | group D | some college | free/reduced | none | 57 | 76 | 77 | 70.000000 | F |
| 3 | male | group B | some college | free/reduced | none | 70 | 70 | 63 | 67.666667 | C |
| 4 | female | group D | associate's degree | standard | none | 83 | 85 | 86 | 84.666667 | B |
Note, since this is an elementwise function, it takes each row entry as input into the given function, we cannot call this function directly on a DataFrame object. Doing so gives an error, as below.
#note xmode Minimal shortens the error message
%xmode Minimal
student_scores_df[['math score']].apply(letter_grade)
Exception reporting mode: Minimal
ValueError: The truth value of a Series is ambiguous. Use a.empty, a.bool(), a.item(), a.any() or a.all().
Applymap Method#
To apply a function elementwise we can do one of the following:
Use .apply() on a Series object
Use .applymap() on a DataFrame object
The general format for .applymap matches the format for .apply and is given by
df.applymap(given_function)
where df is a DataFrame and given_function can be a built-in or user defined function.
Below we correct the error message from trying to use apply for elementwise operations by using applymap.
student_scores_df[["math score"]].applymap(letter_grade).head(5)
/tmp/ipykernel_532/3093511602.py:1: FutureWarning: DataFrame.applymap has been deprecated. Use DataFrame.map instead.
  student_scores_df[["math score"]].applymap(letter_grade).head(5)
| math score | |
|---|---|
| 0 | F |
| 1 | A |
| 2 | F |
| 3 | C |
| 4 | B |
We can also use .applymap on multiple columns of the data!
student_scores_df[['writing grade', 'reading grade']] = student_scores_df[['writing score', 'reading score']].applymap(letter_grade)
student_scores_df.head(5)
/tmp/ipykernel_532/3762512864.py:1: FutureWarning: DataFrame.applymap has been deprecated. Use DataFrame.map instead.
  student_scores_df[['writing grade', 'reading grade']] = student_scores_df[['writing score', 'reading score']].applymap(letter_grade)
| gender | race/ethnicity | parental level of education | lunch | test preparation course | math score | reading score | writing score | Average Score | math grade | writing grade | reading grade | |
|---|---|---|---|---|---|---|---|---|---|---|---|---|
| 0 | female | group D | some college | standard | completed | 59 | 70 | 78 | 69.000000 | F | C | C |
| 1 | male | group D | associate's degree | standard | none | 96 | 93 | 87 | 92.000000 | A | B | A |
| 2 | female | group D | some college | free/reduced | none | 57 | 76 | 77 | 70.000000 | F | C | C |
| 3 | male | group B | some college | free/reduced | none | 70 | 70 | 63 | 67.666667 | C | D | C |
| 4 | female | group D | associate's degree | standard | none | 83 | 85 | 86 | 84.666667 | B | B | B |
Across Columns#
To illustrate how to apply a user defined function across columns, we define a function max_score that takes the maximum over three specific entries. That is, for a fixed row the maximum column entry over math, reading, and writing is retrieved.
def max_score(df):
    '''Takes maximum over math, reading, and writing'''

    return max(df['math score'], df['reading score'], df['writing score'])
We can call this function directly on the entire DataFrame, or just the rows of interest. Since our function only uses these three columns, both lines of code below are acceptable.
student_scores_df.apply(max_score, axis = 1)
0      78
1      96
2      77
3      70
4      86
       ..
995    77
996    80
997    86
998    80
999    58
Length: 1000, dtype: int64
student_scores_df[['math score', 'reading score', 'writing score']].apply(max_score, axis = 1)
0      78
1      96
2      77
3      70
4      86
       ..
995    77
996    80
997    86
998    80
999    58
Length: 1000, dtype: int64
With these tools, we can apply both built-in and user defined functions across the rows or columns of DataFrames.
Note, if you are applying many different functions to DataFrames, or a function with multiple inputs, you may benefit from additional tools like lambda functions. These are anonymous functions that are not defined before use. For now, defining functions as above should suffice, but for those curious, more information on lambda functions can be found here.